
R-Squared in Action
Is There a Superhero Bias?

As a child of the 90’s, I had no shortage of superheroes to admire: the Teenage Mutant Ninja Turtles, the PowerRangers, Mermaid Man and Barnacle Boy, the Teen Titans. As soon as a commercial break hit, my sister and I would jump up and balance on the back of the couch, fighting each other with homemade swords made from my erector set1. Somehow, I always ended up playing a male character (my sister’s decision), illustrating what seemed like my Dad’s favorite lesson (sometimes, life just isn’t fair). But was this unfairness self-inflicted, or do female superheroes receive less representation? Grab your lasso (regression) of justice… today, we’re going to find out!
The Dataset
Today, we’ll be taking a look at data web-scraped from the Marvel Wikia for a FiveThirtyEight article that was published 2014. The raw data (click the link!) contains many variables, but today we’re going to focus on three:
Appearances: the number of times a superhero has appeared in Marvel’s comic books in a given year;
Year: the year of comic book publication; and
Gender: the categorical gender of the superhero (male, female)2.
As Walt Hickey, the author of the original FiveThirtyEight article, notes, raw counts illustrate that (1) there are more male superheroes than there are female superheroes, and (2) some superheroes see exponentially more page time than do others (think Captain America vs. Angar the Screamer).
Walt used descriptive statistics to answer this research question: he directly compared raw appearance counts across genders. Descriptive statistics are fantastic when your goal is to describe the characteristics of the data you’ve collected, without considering the extent to which the variable of interest (The Good) contributes to the changes observed in the outcome measure, relative to other variables (The Bad and The Ugly).
I’ve elected to use null hypothesis significance testing (NHST) instead. NHST goes a step beyond considering the patterns in raw data - it tells us the extent to which the variables we’ve chosen to focus on can explain changes in our outcome measure. It also tells us how confident we should be in reporting our findings by taking into account other key pieces of information, such as (1) the size of the variables’ effect, (2) the sources of variability in our data, and (3) the size of our sample. When NHST indicates low confidence in the predictive power of our variables, we often do not report an effect because it is unlikely that our results will generalize out-of-sample. Sometimes, I refer to this as “making a false discovery” or “lying” to our stakeholders. Regardless of what you call it, it simply means that either (1) the effect is too small, (2) there is too much unexplained variability in the outcome measure, or (3) the sample is too small to confidently draw conclusions.
Our Statistical Model
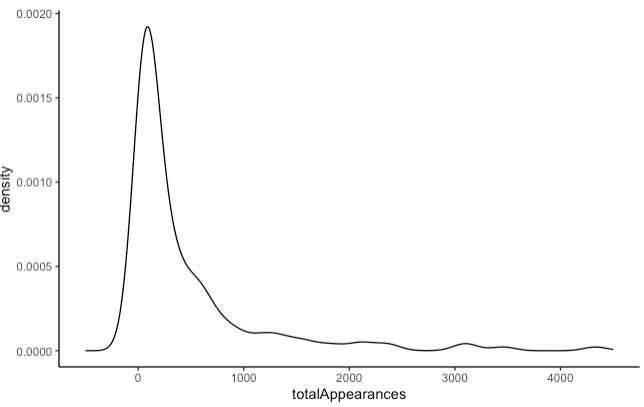
To keep things simple, I’m going to run a linear regression3 that determines whether a Marvel superhero’s number of appearances depends on their gender. I’m also going to include year as a covariate4 to control for increases in character popularity over time. Since number of appearances has a strong positive skew, I’ve log transformed it to ensure our residuals meet the assumptions of the model5. This model will allow us to answer two questions:
Do gender and year explain enough variance in number of appearances to conclude with confidence that they are better predictors than the mean? (the omnibus effect)
Is there a large enough difference in male and female superheroes’ number of appearances, relative to the uncertainty of our estimates, to conclude with confidence that the difference observed in our dataset will hold true at other times or with other datasets? (the main effect of gender)
Let’s see what this looks like in practice:
Our non-significant omnibus test tells us that using a superhero’s gender to predict how often they appear in Marvel comics is about as helpful as assuming that every superhero appears in Marvel comics the exact same number of times6. In fact, a superhero’s gender only explains around 2% of the variance in their number of appearances. This is not convincing evidence that female superheroes are under-represented relative to male superheroes! But how does this inferential finding square with the descriptive findings that Walt reports in his 2014 article? Observant readers may also wonder how our non-significant omnibus effect squares with the significant main effect of gender.
Seek to Understand The Why, Not Just The What
It is undeniable that female superheroes appear less often on Marvels pages than do male superheroes. This is a descriptive, statistical fact. It is also undeniable that female superheroes are less prevalent in the Marvel Universe than are male superheroes, a fact that bears out both in the descriptive and inferential statistics7. The significant main effect of gender embedded within our regression tells us we are confident that gender matters; however, our non-significant omnibus effect tells us that it doesn’t matter much relative to other factors that we’ve left out of our model. Framed differently, our inferential statistics reveal that we are missing an important part of the picture, that there is likely greater nuance to our research question than we initially believed. By conducting additional exploratory data analyses, we can try to understand why females are appearing less often on Marvel’s pages, which I would argue is a much more helpful research question!
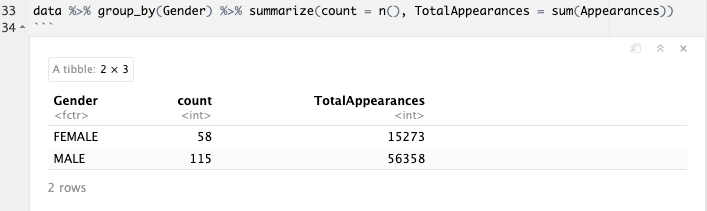
If we take a look at the appearance records of Marvel’s superheroes, separated by gender, we see considerable overlap in the distributions of male and female heroes. The observed differences seem to be driven by a small number of ultra-published heroes who appear in Marvel’s comics more than 1,000 times.
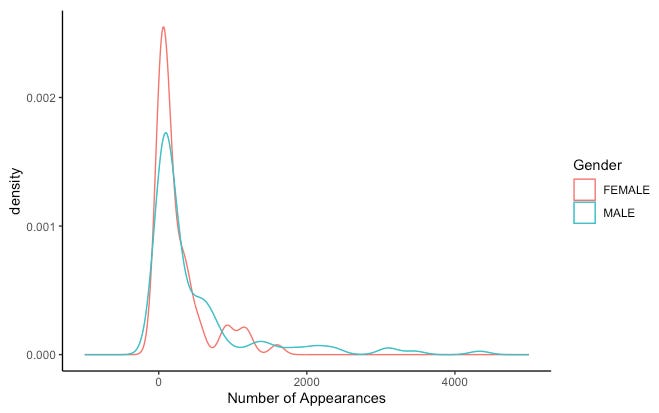
These findings are also confirmed by descriptive summary statistics, which reveal that male superheroes appear more often (M = 490.1), but that there is greater variability in their appearance records (SD = 782.2)8. Female superheroes appear less often in the pages of the franchise (M = 263.3), but more consistently (SD = 358.6)9. Although some male superheroes see more page time than females do, some are under-published even relative to female superheroes. Additionally, there is greater consistency in the frequency with which women appear in the franchise.
So who are these ultra-published heroes, anyway?
Subsetting the data reveals that there are 20 ultra-published heroes who appear more than 1,000 times across Marvel’s pages:
Peter Parker (Spiderman; n = 4333)
Steven Rogers (Captain America; n = 3458)
James Howlett (Wolverine; n = 3130)
Anthony Edward "Tony" Stark (Iron Man; n = 3068)
Thor Odinson (Thor; n = 2402)
Benjamin Grimm (the Thing; n = 2305)
Reed Richards (Mr. Fantastic; n = 2125)
Robert Bruce Banner (the Hulk; n = 2089)
Henry P. McCoy (the Beast; n = 1886)
Susan Richards (the Invisible Woman; n = 1761)
Ororo Munroe (Storm; n = 1598)
Namor McKenzie (the Submariner; n = 1561)
Clinton Frances Barton (Hawkeye; n = 1456)
Matt Murdoch (Daredevil; n = 1375)
Dr. Stephen Vincent Strange (Dr. Strange; n = 1324)
Henry Jonathan “Hank” Pym (Ant Man; n = 1269)
Wanda Maximoff (The Scarlet Witch; n = 1214)
Janet van Dyne (the Wasp; n = 1165)
Natalia Alianovna Romanova (Black Widow; n = 1112)
Victor Shade (The Vision; n = 1036)
That these superheroes are ultra-published is intuitive: they are arguably the most popular heroes in the Marvel franchise. They also happen to be disproportionately male (n = 16). The majority (n = 16) have been in the franchise for 25 years or more. The idea that these heroes’ publication records are driven by their longevity is unfounded: we included publication year in our model as a covariate and it did not explain more than 2% of superheroes’ appearance records. There must be something else that’s special about these heroes that we didn’t include in our model. Unfortunately, the dataset is too limited10 to determine exactly what contributes to a hero’s publication record, but here are a few hypotheses that fit our data:
female superheroes tend to be cast in supporting roles. Consequently, they appear less often relative to their male counterparts but with greater consistency than males, who are either ultra-published heroes or lesser characters. (suggested by our descriptive summary statistics)
To SRF this hypothesis, we would need to obtain information about each superhero’s role (e.g., primary, secondary, villain) and create a model that could test for a practically significant effect of role on appearance records.
male superheroes are preferred by the comic-reading public relative to female superheroes for reasons aside from their gender. Perhaps they are given more exciting plot lines, are more relatable to the readership, or have qualities and characteristics that are greatly admired. (suggested by our inferential statistics)
To SRF this hypothesis, we would need to obtain multiple pieces information about each superhero (e.g., relatability score; excitement score) and create a multiple linear regression that could test for a practically significant effect of any of these variables on appearance records.
These hypotheses are not recommendations to increase female superheroes’ under-representation in comics! Further research and analysis are required to Support or Refute these hypotheses with Facts. Not sure how to SRF? No worries! Grab your SRFboard… the Silver Surfer and I will meet you there!
sorry, Mom!
This dataset does not include transgender superheroes, such as Dr. Charlene McGowan, which restricts our conclusions to the depiction of cis-gendered heroes in the Marvel franchise.
Another alternative (for those who are statistically inclined) might be to run a Poisson regression, which better accommodates the integer nature of the residuals.
A covariate is a variable that we include that may explain variability in the outcome measure, but which isn’t directly related to our research question of interest.
Linear regression requires four assumptions to be met: (1) normally distributed and (2) heterogeneous residuals; (3) independence of observations; and (4) the observed relationship must be linear.
If you have no information available with which to make a prediction, the best guess is the mean. That’s what the null model assumes.
X2(1, N = 173) = 18.78, p < .001.
If you need a refresher on means or standard deviations, check out these explanations by Statistics by Jim!
These descriptive statistics also reflect a known phenomenon, that the mean is affected by skewed distributions (i.e., outliers).
The dataset notes their first episode and the number of years they’ve been in the franchise (both of which are collinear with year), as well as the number of times they’ve died and been resurrected.