

I’ve mentioned before that my Dad and I love a spontaneous game of Name That Tune. During my visit last week, we managed to squeeze in a few good games1. My personal favorite was inspired by the figurines we found on a family hike. Hey, aren’t those like our own… personal… Jesuses?, I asked. Who was it that sang that song?, my Dad asked. Was it Depeche Mode?, we asked in unison. Yes, I said, I think that was it.

Name That Tune is not a puzzle that can easily be solved using a guess-and-check framework. Can you imagine my Dad and me singing Personal Jesus in the style of Johnny Cash (no2), the Buggles (no), or Gary Numan (close, but no cigar)? It’s more efficient to solve Name That Tune by considering the qualities and characteristics of the music and estimating the likelihood that they may have been produced by a given band. Today, I’ll use this musical example to illustrate a model fitting approach known as maximum likelihood estimation (MLE)3. This approach, which relies on probability, is very different from the least squares estimation approach (and corresponding R2 fit metric) that we discussed in my last set of posts.
Read on to learn more about maximum likelihood estimation. Who knows? Maybe you’ll discover your own… personal… reason… to integrate this approach into your statistical practice!
Getting Started: an Interlude about Music
In modern music theory, a band’s music can be described by eleven characteristics4, which I like to think of as belonging to three broad categories:
the sound, which includes the song’s melody, harmony, pitch, and instrumentation (timbre); and
the beat, which includes characteristics like the pattern (rhythm; form) and organization (meter) of the beat, as well as the complexity of the music (texture); and
the overall quality, which is informed by how quickly (tempo), loudly (dynamics), and long (duration) the band members play both individual notes and the entire piece.
These characteristics can be quantified in various ways to create a model of a band’s sound. For example, Dan Carr, who writes articles on music theory, has captured information about Depeche Mode’s sound by noting the chord progressions of five songs:
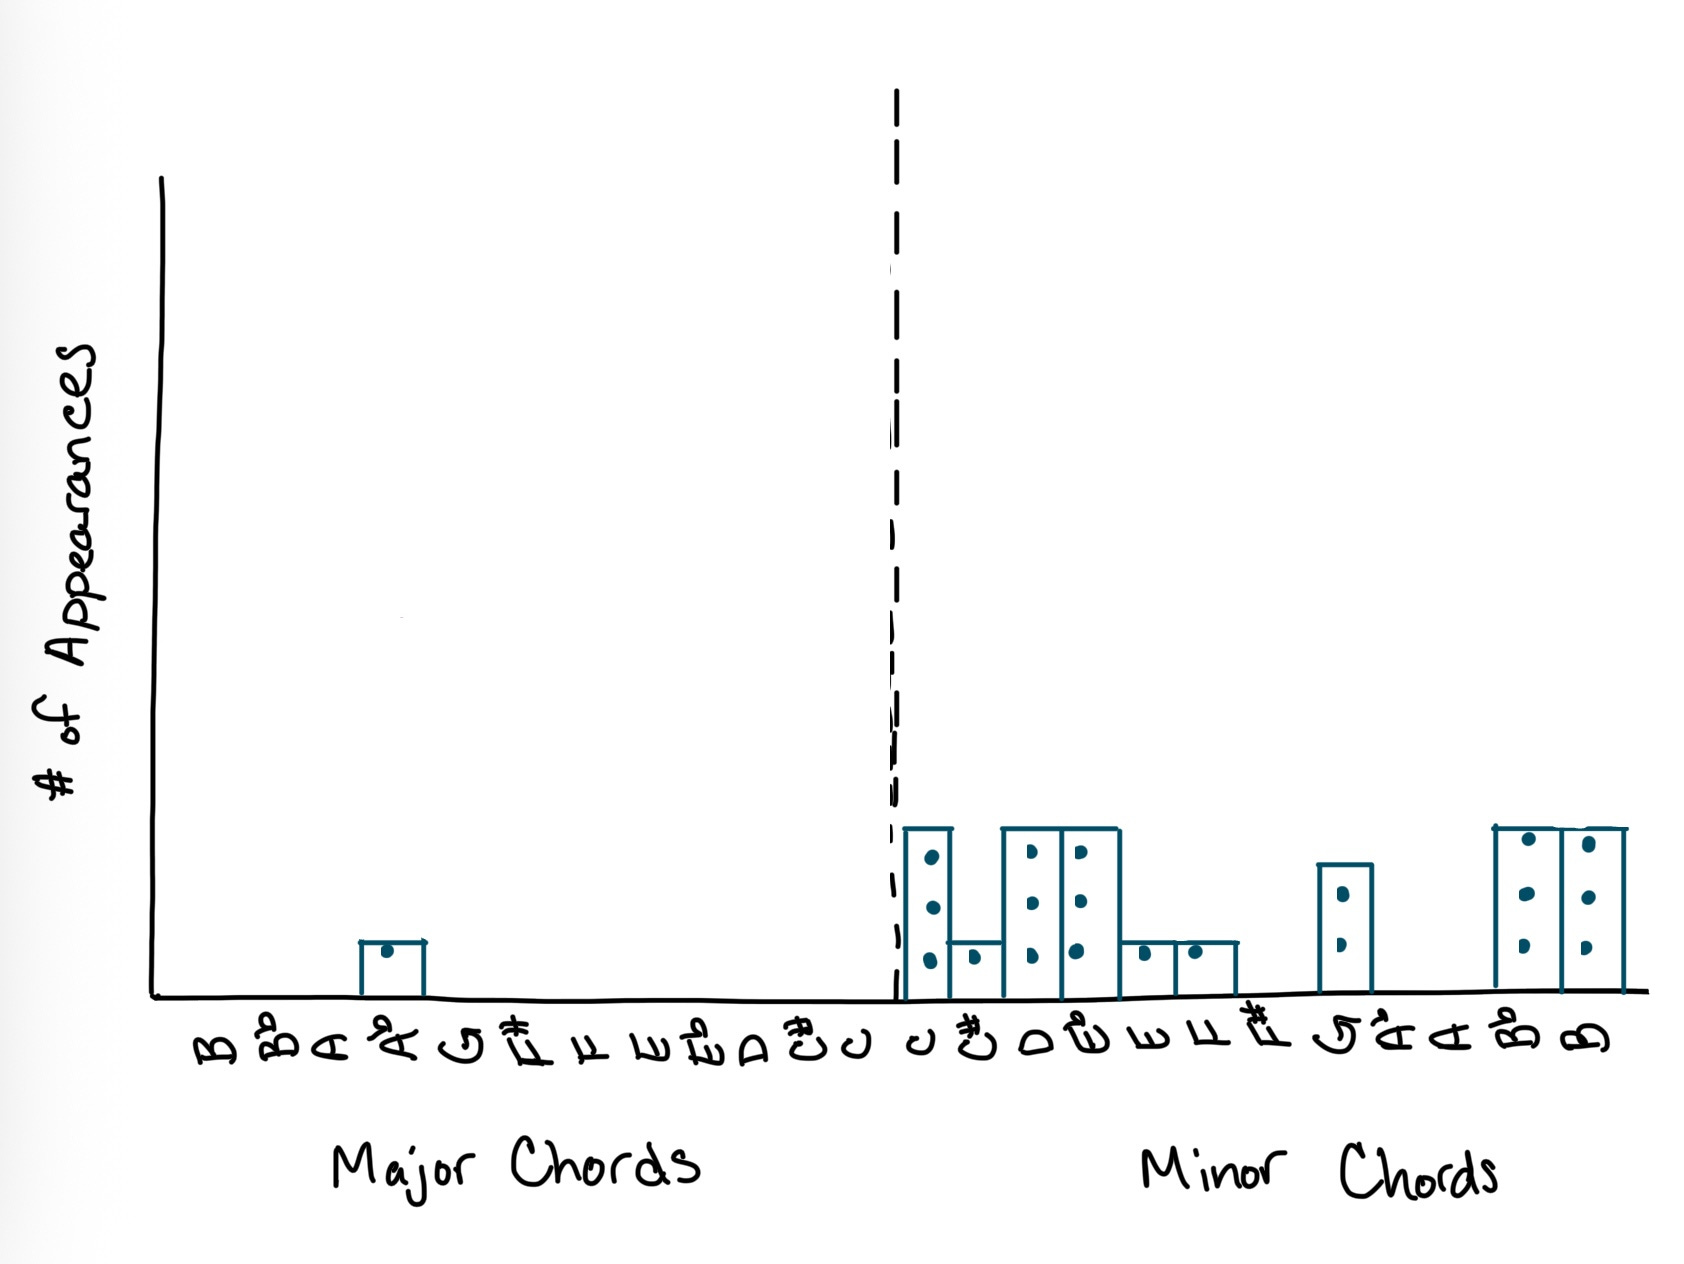
In theory, an underlying generating process gives rise to the particular set of chord progressions that defines Depeche Mode’s music (Carr refers to this as “Martin Gore’s songwriting style”). Since scales share an ordinal relationship5 with one another, we could quantify this information relative to a baseline scale of C, with successive minor chords taking on increasing positive values and successive major chords taking on decreasing negative values6. We could then use this numerical representation of Depeche Mode’s sound to estimate a simple model of Martin Gore’s songwriting style.
Maximum Likelihood Estimation
Maximum Liklihood Estimation (MLE) assumes that every phenomenon has an underlying generating process. This is just a fancy way to say that there’s a consistent, true relationship that gives rise to the data we observe. Sometimes, I refer to this as the True Core of the phenomenon that I want to model. When we’ve systematically collected data about a phenomenon of interest, it’s easy to use MLE to estimate a model!
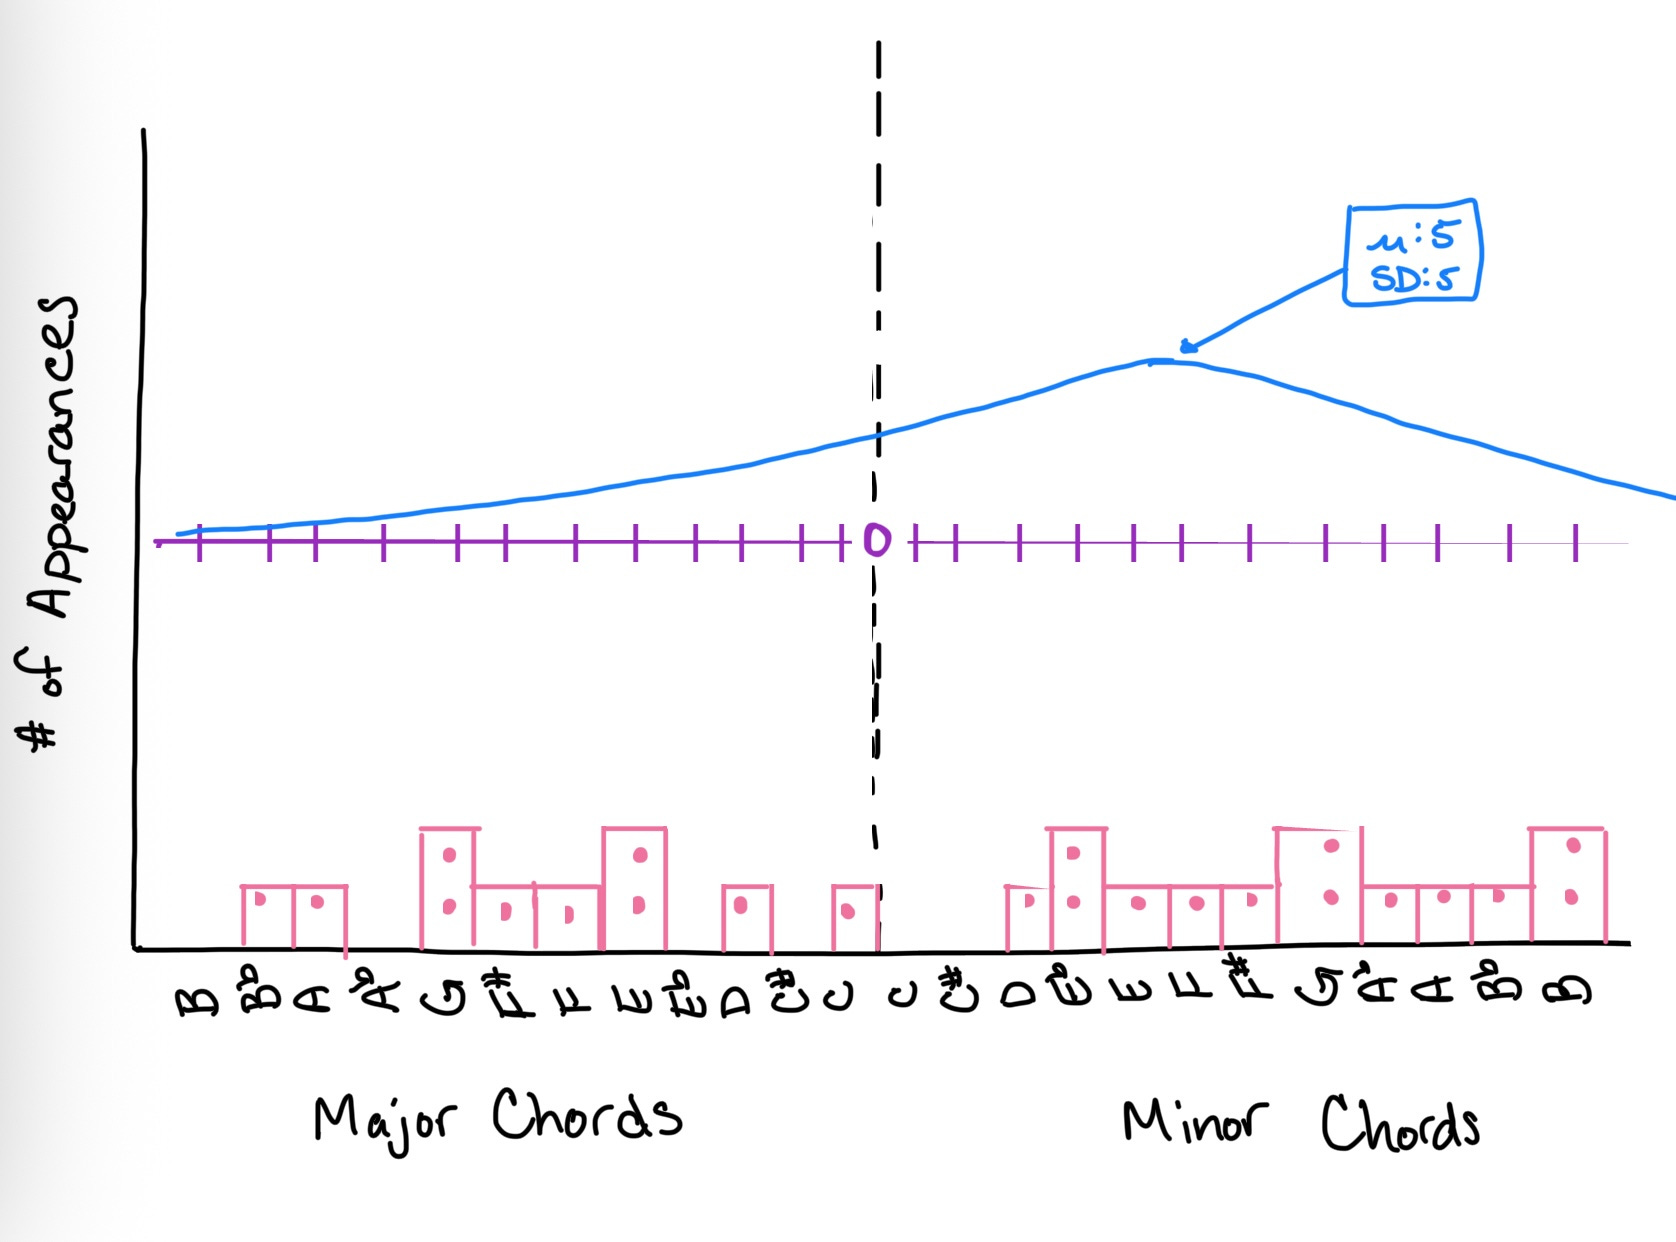
A simple model of Martin Gore’s songwriting style might be the mean (i.e., center) and standard deviation (i.e., spread) of the chord progressions found in Depeche Mode’s songs. There are many possible (M, SD) combinations that we could use to model this phenomenon, but some of these possible generating functions will fit better than others:
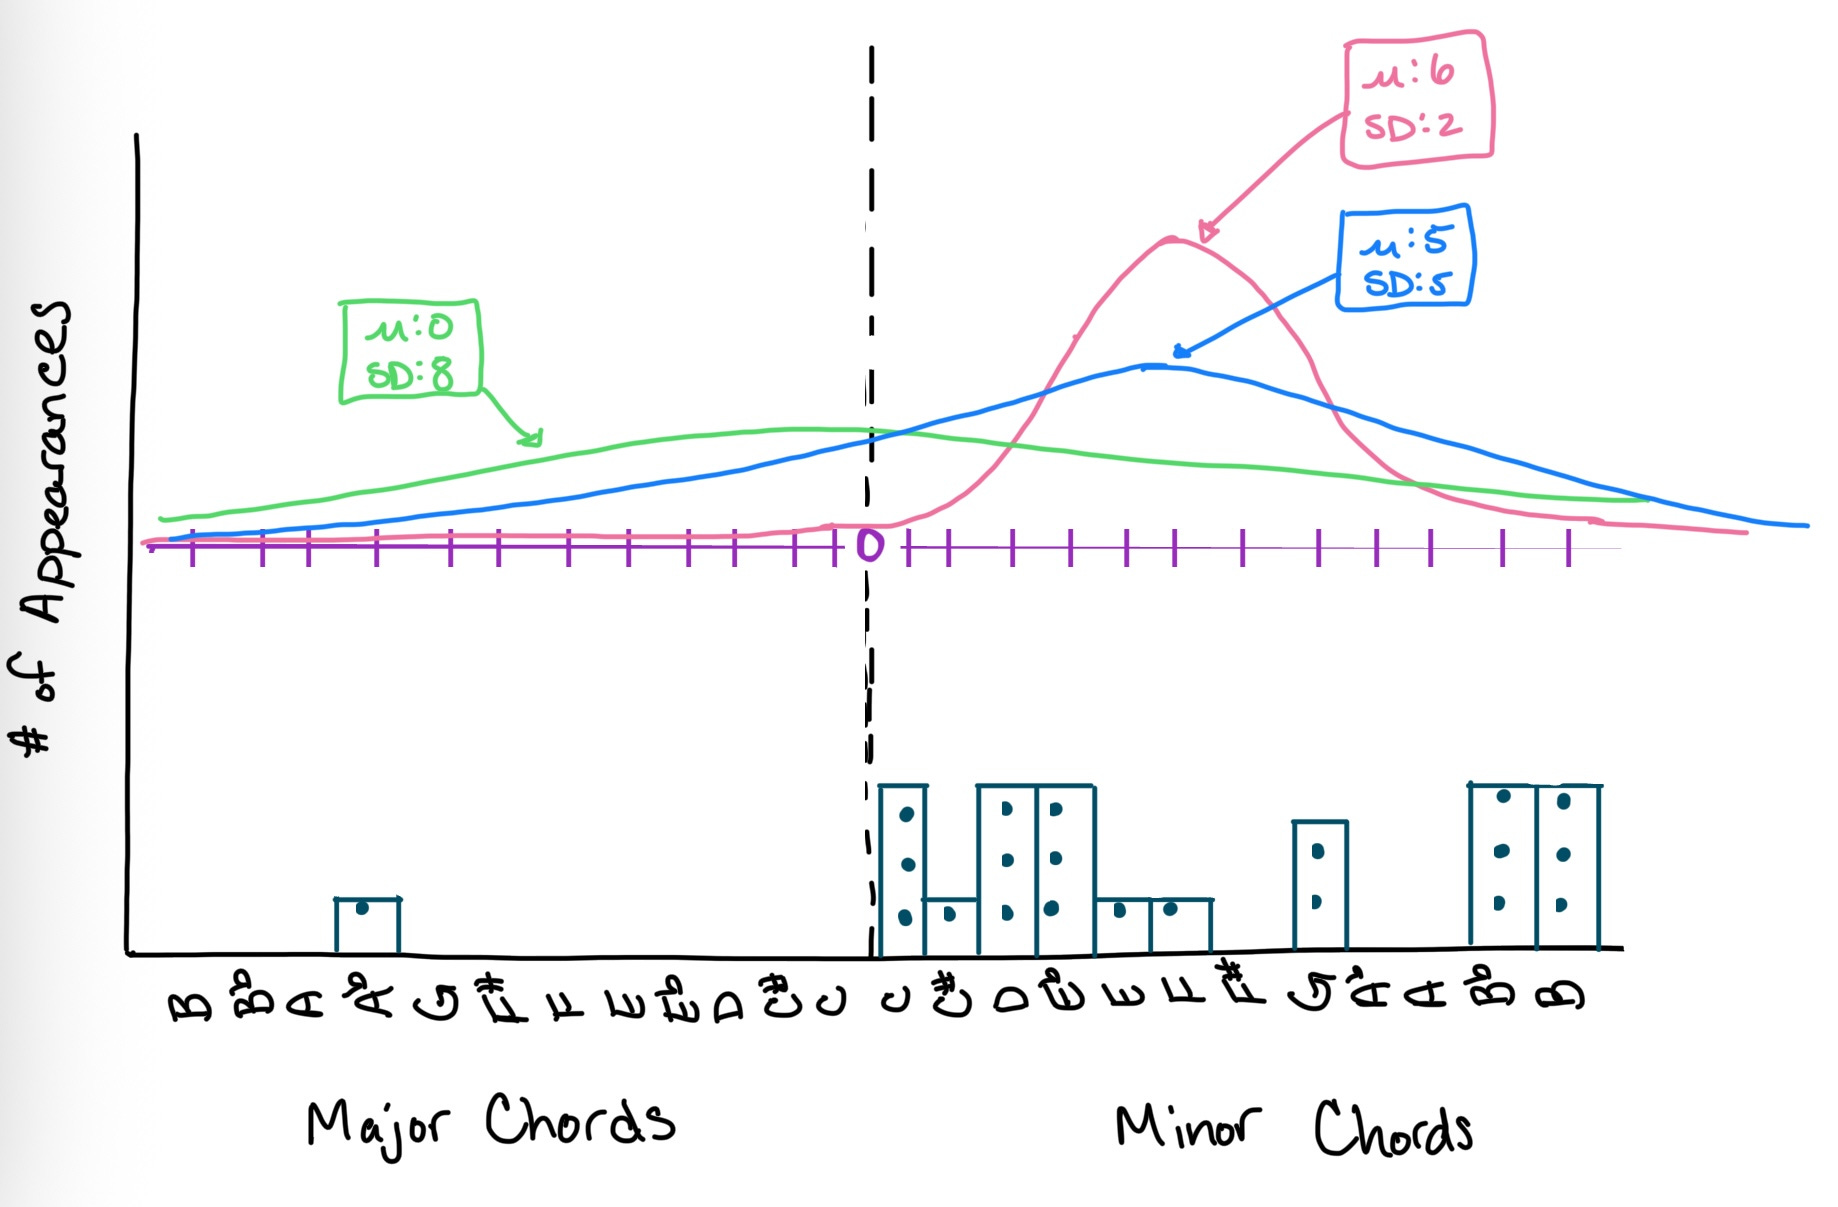
The blue function, which has a mean (M; i.e., center) at 5 and a standard deviation (SD; i.e., spread) of 5, is the most likely to have produced our data. Although the mean of the pink function is in the correct place, its standard deviation excludes the Ab major chord. And although the green function clearly captures the standard deviation of the data, the mean of this distribution is in the wrong place.7
If we were actually creating and evaluating a mathematical model, the statistical program on our computers would calculate the probability associated with many possible combination of mean and standard deviation values (not just the three I’ve illustrated here). Sometimes, statisticians illustrate this as a probability density function or as a probability density heat map.
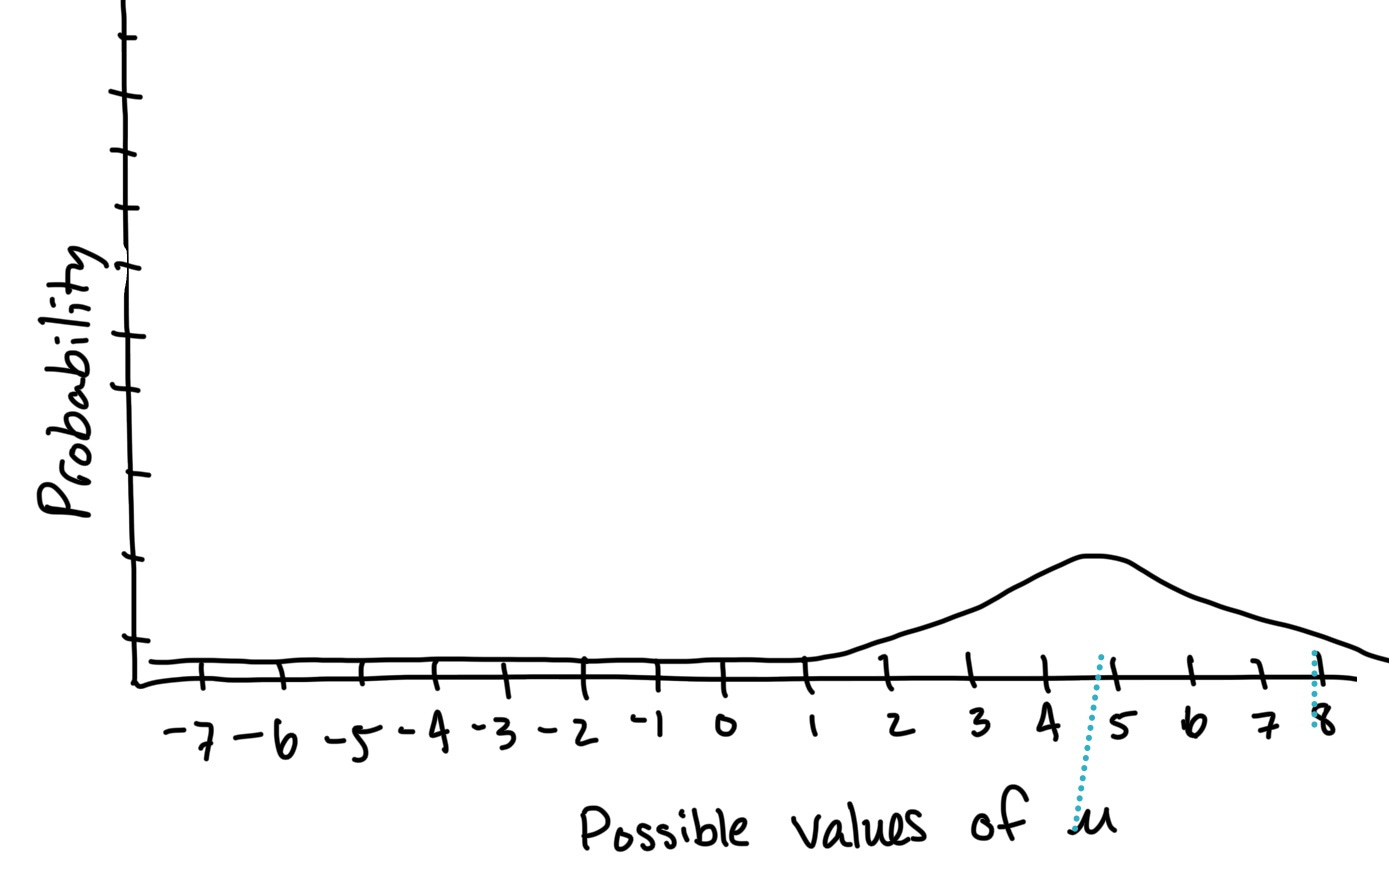
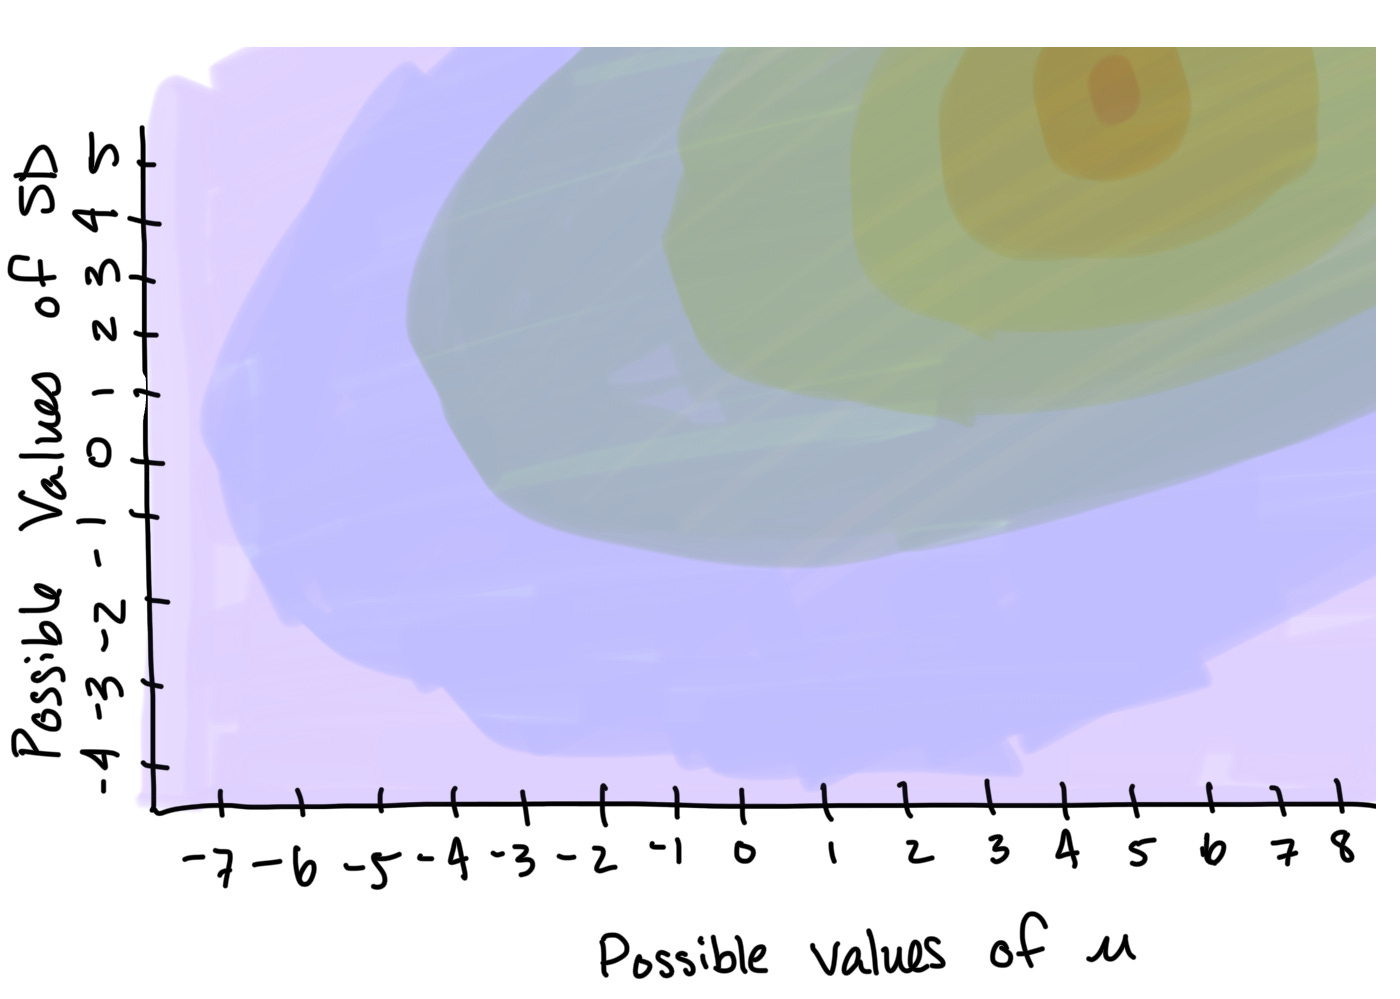
Our statistical software doesn’t need to visualize these probabilities; it simply selects and returns the underlying generating function most likely to be responsible for the phenomenon we’re trying to estimate. In statistical speak, this is sometimes referred to as converging on parameter values that optimize the maximum likelihood function.
-LL: Your Statistical Software’s MLE Tool
Your statistical software’s MLE approach is summarized by a single number called -LL (the negative log likelihood). The -LL is based on the various components we discussed in our intuitive example:
the observed data;
the probability of observing the data, given a set of parameter values;
These pieces of information are captured in a somewhat cryptic formula, which I’ve written two different ways:
In this formula, fx represents the probability density function (think about our earlier visualization), and xi represents each parameter you want to estimate. The formula includes a summation function (the big, funky E; aka., Greek letter sigma) because we need to calculate the joint probability associated with the combination of predictors in our model (i.e., think about our probability density heat map, which illustrates the join probability of two predictors). We take the natural log (ln) of this function to scale it to a range of values that makes it easier to analyze. Finally, our statistical software then uses calculus to identify the highest point of this joint probability function. The set of parameter values associated with this point becomes our model8.
Using Models for Prediction
One a generating function (i.e., a statistical model) is identified, it can then be used to predict out-of-sample, similar to how my Dad and I correctly guessed that Depeche Mode was responsible for the song Personal Jesus. Consider this visualization of some of Thundercat’s chord progressions alongside our simple model of Martin Gore’s songwriting style:
Clearly, there’s not a strong match. Although it is possible that a song containing these chords was produced by Depeche Mode, it is far more likely to have been produced by another artist.
What’s Next?
Now that we’re familiar with MLE and the -LL, we can use it to evaluate our existing model of superhero popularity and see if we can improve upon it (I have some tricks up my sleeve!). See you next time!
sorry, Mom.
technically, Johnny Cash covered the song in 2002!
MLE is one approach to model estimation; however, it is not the only approach a statistician could take. For example, the popular app Shazam uses a very different algorithmic approach that you can read more about in Wang’s (2003) paper.
Since I’m not a music theory expert, you can check out Robertson’s (2025) blog post for a more thorough description.
This is just a fancy way to say that we can organize these scales in a meaningful order. Here, I’ve arranged the scales based on their absolute distance from C (considered the “middle” of a piano), with minor scales represented by negative numbers and major scale represented by positive numbers.
We could just have easily started with any other central value (e.g., 5, 10, 45) or placed minor chords on the negative end of the scale. Since scales are ordinal, our numbers capture only their ordered relationship without conveying information about the relative distances between the scales. This doesn’t mean anything about the scales, simply that we’re representing this musical information in a numerical way. If you want to read more about ordinal data, check out this post on Statistics by Jim.
In an alternative universe, I spent time coding these graphs in R instead of traveling to hike with my family. Sorry, not sorry! I promise you, these are what the graphs would look like if you coded them up in your statistical software. Maybe a future post will involve creating some?